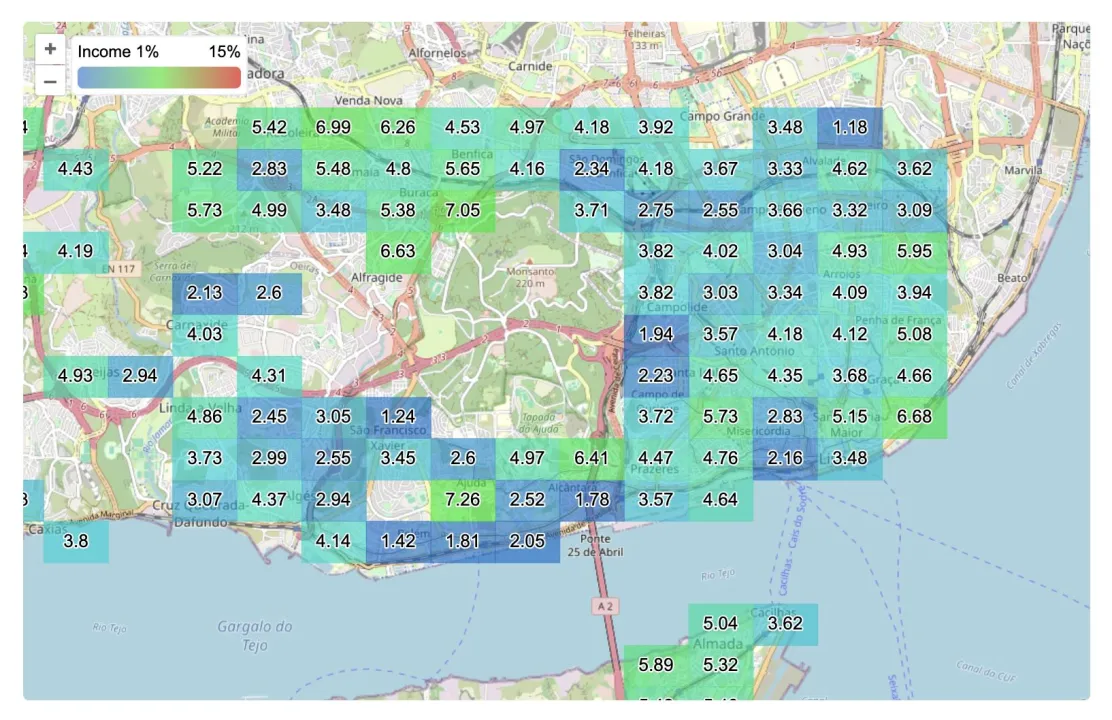
Analyze property profitability across European regions with the Real Estate Income Heatmap. An essential tool for investors, it provides comprehensive data on rental yields, historical trends, and neighborhood comparisons, helping you make confident, data-driven investment decisions.
Key Features
- Property Type Selection: Easily choose between apartments, houses, and commercial properties to tailor the data to your investment needs.
- Search Filters: Narrow down results by parameters such as number of rooms, area, and more to find properties that match your criteria.
- Interactive Heatmap: Navigate through different European neighborhoods, viewing rental yield data in a color-coded format to quickly spot high-yield areas.
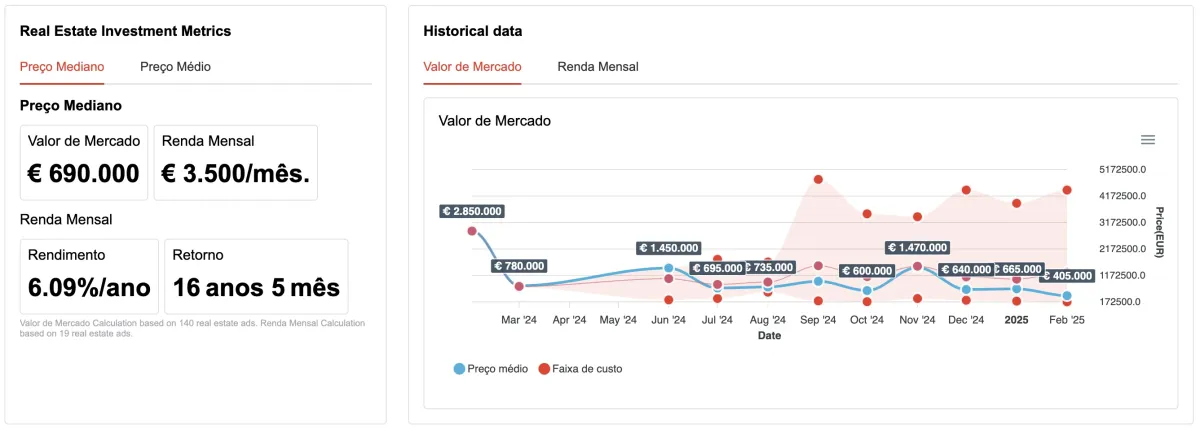
- Detailed Area Statistics: Click on any map block to reveal data on average property and rental prices, yield rates, and payback periods specific to that neighborhood.
- Historical and Current Listings: Examine property trends over the past 2–24 months to understand market dynamics and forecast potential profitability.
Benefits of Using Real Estate Income Heatmap
The Real Estate Income Heatmap is designed for investors seeking a streamlined approach to analyzing property investments across Europe. Here’s how it can enhance your decision-making:
- Data-Driven Decisions: Access extensive data to support informed property investment choices in competitive markets.
- All-in-One Analytics: View critical statistics, such as average rental yields and occupancy rates, within a single platform.
- Easy and Intuitive: Our user-friendly interface allows you to customize search filters, effortlessly navigating European property markets.
What is the Real Estate Income Heatmap?
The Real Estate Income Heatmap is an innovative tool that allows you to get a complete picture of investment profitability in real estate, displaying the average yield for each block on the map.
How to choose a property type?
You can choose the type of property you are interested in: apartment, house, or commercial property. This will help you obtain more accurate data.
Can I customize search parameters?
Yes, you can select additional parameters, such as the number of rooms, area, and other characteristics, to find properties that meet your requirements.
How does the interactive map work?
Move the map to explore different neighborhoods and see the heat map of rental yields from long-term real estate rentals. Convenient navigation allows you to quickly find the information you need.
How to obtain additional statistics for blocks?
Click on any block on the map to access detailed statistics, including the average property price, average long-term rental price, average yield, and payback period.
What is the analysis of archived and current listings?
Our tool allows you to select a search period for archived and current listings from 2 to 24 months, giving you the opportunity to see price and yield trends over a specific period.
What are the benefits of using the Real Estate Income Heatmap?
You gain access to data for making informed decisions, all necessary statistics are collected in one place, and the intuitive interface makes the process simple and enjoyable.
How to use the Real Estate Income Heatmap?
Use this tool to analyze and evaluate real estate investments to maximize your profit and minimize risks.
Where do you get the data from?
We collect data from various open sources, including our own data from M-SQ.
What prices do you collect?
We collect prices from listings, which may not reflect the actual transaction value.
In which regions do you operate?
We strive to cover as many regions as possible, but mainly these are European countries: Portugal, Spain, Bosnia and Herzegovina, Latvia, and others.

